Richest Cities in Illinois (2026)
by Kristen Carney
Updated: February 9, 2026
Richest City in Illinois
The richest city in Illinois is Kenilworth in Cook County with an average household income of $486,298 as of 2024. While exceptionally affluent, Kenilworth only has a population of 2,503 as of 2024. The richest city in Illinois with at least 5,000 people is Winnetka in Cook County with an average household income of $484,635 as of 2024 and 12,484 people as of 2024 according to the most current Census data available (citation).
| Rank | City | County | Population | Average Income | Median Income |
|---|---|---|---|---|---|
| 1 | Kenilworth | Cook | 2,503 | $486,298 | $250,001 |
| 2 | Winnetka | Cook | 12,484 | $484,635 | $250,001 |
| 3 | Glencoe | Cook | 8,701 | $424,521 | $248,933 |
| 4 | Bannockburn | Lake | 1,148 | $369,121 | $214,000 |
| 5 | Hinsdale | Cook; DuPage | 17,175 | $367,874 | $250,001 |
| 6 | Hollowayville | Bureau | 25 | $364,382 | -$1 |
| 7 | Long Grove | Lake | 8,305 | $355,039 | $250,001 |
| 8 | Riverwoods | Lake | 4,013 | $339,118 | $249,205 |
| 9 | Barrington Hills | Cook; Kane; Lake; McHenry | 3,879 | $324,940 | $205,074 |
| 10 | Golf | Cook | 518 | $323,764 | $242,772 |
| 11 | Kildeer | Lake | 4,292 | $313,096 | $250,001 |
| 12 | Western Springs | Cook | 13,446 | $310,563 | $230,255 |
| 13 | Lake Forest | Lake | 19,416 | $303,251 | $235,081 |
| 14 | North Barrington | Lake | 3,143 | $301,650 | $226,055 |
| 15 | South Barrington | Cook | 5,021 | $301,587 | $221,575 |
| 16 | Wilmette | Cook | 27,503 | $300,005 | $190,662 |
| 17 | Lake Bluff | Lake | 6,041 | $290,230 | $204,000 |
| 18 | Oak Brook | DuPage | 8,056 | $271,560 | $175,870 |
| 19 | Hawthorn Woods | Lake | 9,143 | $264,540 | $219,631 |
| 20 | Northfield | Cook | 5,487 | $264,530 | $161,500 |
Median Income versus Average Income: Which Should You Use?
We usually suggest using median income data – either instead of or in addition to – average income data as a true indicator of wealth. If you haven’t thought about median versus average since your last standardized test, you aren’t alone. Here’s what they are:
- average is the sum of a set of numbers divided by the count of numbers in the set
- median is the middle number in the set of numbers
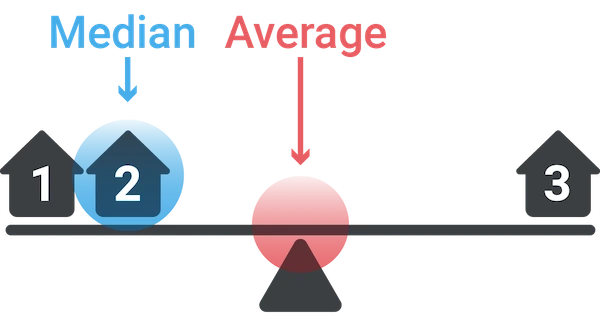
Now let’s say you had the following simplified set of income data.
Household 1: $30,000
Household 2: $50,000
Household 3: $1,000,000
The average income for this set is $360,000. The outlier data point ($1,000,000) skews the average WAY up. Conversely, the average income would be skewed WAY down if someone had an income of $500. The median income for the same data set is $50,000. Outlier data doesn’t skew the median.
Most Business Owners Should Use Median Income
So most business owners should use the median income as a true indicator of wealth, because it provides a more accurate representation of a typical income, especially in areas with significant income disparity.
When Should You Use Average Income
If your target market is high-income households, the average income may be more relevant. This is because the average income can highlight the presence of a higher concentration of wealthy individuals, which is beneficial for luxury goods and services marketing. We’re using average income on this page because using the Census’s highest reported median value of $250,001 could result in multiple ties for the richest geography.
Why do so many cities have a median value of $250,001?
The Census' American Community Survey uses $250,000+ as a jam value for median income estimates to protect privacy, ensure data consistency, and simplify reporting. A "jam value" in survey data refers to a placeholder or default value used when actual data points are unavailable, incomplete, or exceed certain thresholds. We represent this jam value as $250,001 to make it easy for you to sort.
You might also be interested in:
Email Me When New Data Are Released
Join thousands of subscribers and receive just 1 (ONE!) email a year in December when the US Census Bureau releases new income data for Illinois richest cities.
SOURCES
United States Census Bureau. Annual Estimates of the Resident Population: April 1, 2020 to July 1, 2023. U.S. Census Bureau, Population Division. Web. May 2024. http://www.census.gov/.
United States Census Bureau. B01001 SEX BY AGE, 2024 American Community Survey 5-Year Estimates. U.S. Census Bureau, American Community Survey Office. Web. 29 January 2026. http://www.census.gov/.
United States Census Bureau. B19013 Median Household Income, 2024 American Community Survey 5-Year Estimates. U.S. Census Bureau, American Community Survey Office. Web. 29 January 2026. http://www.census.gov/.
United States Census Bureau. "DP03 SELECTED ECONOMIC CHARACTERISTICS." 2024 American Community Survey 5-Year Estimates. U.S. Census Bureau, American Community Survey Office. Web. 29 January 2026. http://www.census.gov/.
Products & Services
Plumbing
Connect
- 1-800-939-2130
- Contact Us
© Copyright 2026 Cubit Planning, Inc.